Thermal Comfort

This booklet is an introduction to thermal comfort.
It explains
procedures to evaluate the thermal environment and methods applied for its
measurement.
Contents
What is Thermal
Comfort?
How is Body
Temperature regulated?
How does man
evaluate the Thermal Environment?
First conditions
for Thermal Comfort
The Comfort
Equation
Metabolic Rate
estimation
Clo value
calculations
What should be
measured?
What is Mean
Radiant Temperature and how to measure it?
What are
Operative, Equivalent and Effective Temperatures?
Operative and
Equivalent Temperature can be measured directly
How to create
Thermal Comfort
The PMV and PPD
scales
Local Thermal
Discomfort
Draught
Evaluating
the Draught Rate
Asymmetry of
Thermal Radiation
Vertical Air
Temperature Difference
Floor
Temperature
How to perform a
measurement in a workplace
How to evaluate
the Thermal Quality of a room
Further
Reading
Appendices:
A: Dry Heat Loss
calculations
B: Heat Balance,
Comfort and PMV equations
C: Met value
table
D: Clo value
table
E: Calculation of
Mean Radiant Temperature
F: Calculation of
Plane Radiant and Operative Temperature.
Nomenclature
 What is Thermal Comfort? What is Thermal Comfort?
Man has always striven to create a thermally comfortable environment.
This is reflected in building traditions around the world - from ancient
history to present day. Today, creating a thermally comfortable
environment is still one of the most important parameters to be considered
when designing buildings.
But what exactly is Thermal Comfort? It is defined in the ISO 7730
standard as being "That condition of mind which expresses satisfaction
with the thermal environment". A definition most people can agree on, but
also a definition which is not easily converted into physical
parameters.
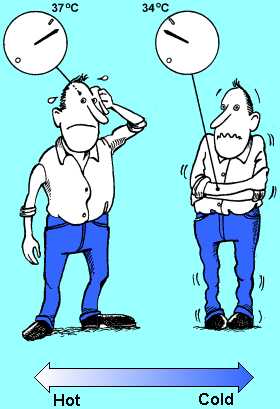
The complexity of evaluating thermal comfort is illustrated by the
drawing. Both persons illustrated are likely to be thermally comfortable,
even though they are in completely different thermal environments. This
reminds us that thermal comfort is a matter of many physical parameters,
and not just one, as for example the air temperature.
Thermal environments are considered together with other factors such as
air quality, light and noise level, when we evaluate our working
environment. If we do not feel the everyday working environment is
satisfactory, our working performance will inevitably suffer. Thus,
thermal comfort also has an impact on our work efficiency.

How is Body Temperature regulated?
Man has a very effective temperature regulatory system, which ensures
that the body’s core temperature is kept at approximately 37°C.
 When the body becomes too warm, two processes are initiated:
first the blood vessels vasodilate, increasing the blood flow through the
skin and subsequently one begins to sweat. Sweating is an effective
cooling tool, because the energy required for the sweat to evaporate is
taken from the skin. Only a few tenths of a degrees increase in the core
body temperature can stimulate a sweat production which quadruples the
body’s heat loss. When the body becomes too warm, two processes are initiated:
first the blood vessels vasodilate, increasing the blood flow through the
skin and subsequently one begins to sweat. Sweating is an effective
cooling tool, because the energy required for the sweat to evaporate is
taken from the skin. Only a few tenths of a degrees increase in the core
body temperature can stimulate a sweat production which quadruples the
body’s heat loss.
If the body is getting too cold, the first reaction is for the blood
vessels to vasoconstrict, reducing the blood flow through the skin. The
second reaction is to increase the internal heat production by stimulating
the muscles, which causes shivering. This system is also very effective,
and it can increase the body’s heat production dramatically.
The control system which regulates the body temperature is complex, and
is not yet fully understood. The two most important set of sensors for the
control system are however known. They are located in the skin and in the
hypothalamus. The hypothalamus-sensor is a heat sensor which starts the
body’s cooling function when the body’s core temperature exceeds 37°C. The
skin-sensors are cold sensors which start the body’s defence against
cooling down when the skin temperature falls below 34°C.
If the hot and cold sensors output signals at the same time, our brain
will inhibit one or both of the body’s defence reactions.
How does man evaluate the Thermal Environment?
Man considers the environment comfortable if no type of thermal
discomfort is present. The first comfort condition is thermal neutrality,
which means that a person feels neither too warm nor too cold.
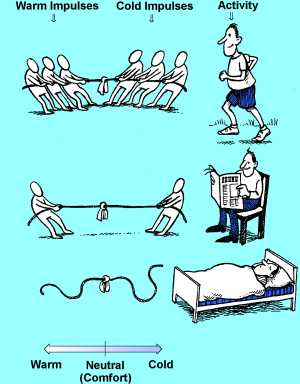 When the skin temperature falls below 34°C, our cold sensors
begin to send impulses to the brain; and as the temperature continues to
fall, the impulses increase in number. The number of impulses are also a
function of how quickly the skin temperature falls - rapid temperature
drops result in many impulses being sent. When the skin temperature falls below 34°C, our cold sensors
begin to send impulses to the brain; and as the temperature continues to
fall, the impulses increase in number. The number of impulses are also a
function of how quickly the skin temperature falls - rapid temperature
drops result in many impulses being sent.
Similarly, the heat sensor in the hypothalamus sends impulses when the
temperature exceeds 37°C, and as the temperature increases, the number of
impulses increase. It is believed that it is the signals from these two
sensor systems that form the basis for our evaluation of the thermal
environment.
The brain’s interpretation of the signals is assumed to be like a
tug-of-war, with the cold impulses at one end of the rope and the warm
impulses at the other. If the signals on both sides are of the same
magnitude, you feel thermally neutral, if not, you either feel too warm or
too cold. A person in a thermally neutral state and completely relaxed
makes for a special case, as he will activate neither the heat or cold
sensors.
It takes some time to change the body’s core temperature; the signal
from the heat sensor therefore change very slowly compared to the signals
from the cold sensors.
First conditions for Thermal Comfort
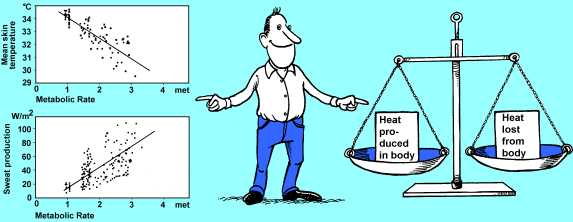
Two conditions must be fulfilled to maintain thermal comfort. One is
that the actual combination of skin temperature and the body’s core
temperature provide a sensation of thermal neutrality. The second is the
fulfilment of the body’s energy balance: the heat produced by the
metabolism should be equal to the amount of heat lost from the body. The
relationship between the parameters: skin temperature, core body
temperature and activity, which result in a thermally neutral sensation,
is based on a large number of experiments. During these experiments the
body’s core temperature, the skin temperature and the amount of sweat
produced were measured at various known levels of activity, while the
testpersons were thermally comfortable. The results of the experiments can
be seen in the figure.
Sweat production was chosen as a parameter instead of the core body
temperature, but as the sweat production is a function of the deep body
and skin temperature this does not in principle change anything in the
thermal sensation model.
No differences between sexes, ages, race and national-geographic origin
were observed in the above experiment, when determining: What is a
thermally comfortably environment? However, differences was observed
between individuals on the same matter.
The equations controlling the energy balance for a person are
relatively simple. They can be seen in Appendix B.
The Comfort Equation
 The equation for comfortable skin temperature and sweat
production can be combined with the equation for the body’s energy balance
to derive the Comfort Equation. This equation describes the connection
between the measurable physical parameters and thermally neutral sensation
as experienced by the "average" person. The equation for comfortable skin temperature and sweat
production can be combined with the equation for the body’s energy balance
to derive the Comfort Equation. This equation describes the connection
between the measurable physical parameters and thermally neutral sensation
as experienced by the "average" person.
The comfort equation provides us with an operational tool which by
measuring physical parameters enables us to evaluate under which
conditions thermal comfort may be offered in a workplace. The Comfort
Equation derived by P.O. Fanger /1/ is too complicated for manual
arithmetic and is normally solved using a computer. The full equation can
be seen in Appendix A and Appendix B.
The equation reveals that the temperature of the surfaces in the
enclosure where a person is has a huge influence on thermal sensation. A
1°C change in surface temperature may under many circumstances have as
large an influence on a persons thermal sensation as a change of 1°C in
the air temperature. Furthermore, the comfort equation reveals that the
humidity level only has a moderate influence on the thermal sensation.
In practise, it is important to know which input parameters the Comfort
Equation requires. These are:
• 2 table values giving the persons activity and clothing levels. (Clo
and Met values).
• 2-4 measured parameters describing the thermal
environment in the workplace.
Metabolic Rate estimation
 The metabolism is the body’s motor, and the amount of energy
released by the metabolism is dependent on the amount of muscular
activity. Normally, all muscle activity is converted to heat in the body,
but during hard physical work this ratio may drop to 75%. If, for example,
one went up a mountain, part of the energy used is stored in the body in
the form of potential energy. The metabolism is the body’s motor, and the amount of energy
released by the metabolism is dependent on the amount of muscular
activity. Normally, all muscle activity is converted to heat in the body,
but during hard physical work this ratio may drop to 75%. If, for example,
one went up a mountain, part of the energy used is stored in the body in
the form of potential energy.
Traditionally, metabolism is measured in Met (1 Met = 58.15 W
/m2 of body surface). A normal adult has a surface area of 1.7
m2, and a person in thermal comfort with an activity level of 1
Met will thus have a heat loss of approximately 100W. Our metabolism is at
its lowest while we sleep (0.8 Met) and at its highest during sports
activities, where 10 Met is frequently reached. A few examples of
metabolic rates for different activities are shown in the diagram. In
addition to this, there is a metabolic rate table in Appendix C. A Met
rate commonly used is 1.2, corresponding to normal work when sitting in an
office. It is interesting to see that domestic work is relative hard work
with Met values of 2.5 and 2.9.
When evaluating the metabolic rate of an individual, it is important to
use an average value for the activities the person has performed within
the last hour. The reason for this is that the body’s heat capacity makes
it "remember" approximately one hour of activity level.
Clo value calculations
Clothing reduces the body’s heat loss. Therefore, clothing is
classified according to its insulation value. The unit normally used for
measuring clothing’s insulation is the Clo unit, but the more technical
unit m2°C/W is also seen frequently (1 Clo = 0.155 m2°C/W).
The Clo scale is designed so that a naked person has a Clo value of 0.0
and someone wearing a typical business suit has a Clo value of 1.0. Some
normal Clo values are shown in the figure. The Clo value can be calculated
if the persons dress and the Clo values for the individual garments are
known, by simply adding the
Clo values together. Appendix D contains a list of clothing items and
their corresponding Clo values.
Obtaining the Clo value through calculation normally gives a sufficient
accuracy. If exact values are required, it is better to measure the Clo
value using a heated mannequin dummy.
When calculating Clo values, it is important to remember that
upholstered seats, car seats and beds reduce the heat loss from the body
too, and therefore, these must be included in the overall calculation.
What should be measured?
When measuring the thermal indoor climate, it is important to remember
that man does not feel the room temperature, he feels the energy loss from
the body. The parameters that must be measured are those which affect
energy loss. These are:
The influence of these parameters on energy loss are not equal, but it
is not sufficient to measure only one of them. For example, Mean Radiant
Temperature frequently has as great an influence as the air temperature on
the energy loss.
To characterise thermal indoor climate using fewer parameters and to
avoid measuring the mean radiant temperature, which is difficult and time
consuming to obtain, some integrating parameters have been introduced. The
3 most important are the Operative Temperature ( to ), the
Equivalent Temperature ( teq ) and the Effective Temperature (
ET* ).
The integrating parameters combine the influence on the heat loss of
the single parameters as follows:
The integrating parameter offers us the convenience of describing the
thermal environment in fewer numbers.
What is Mean Radiant Temperature and how to measure it?
The Mean Radiant Temperature of an environment is defined as that
uniform temperature of an imaginary black enclosure which would result in
the same heat loss by radiation from the person as the actual enclosure.
The equation for the calculation of Mean Radiant Temperature is:
Measuring the temperature of all surfaces in the room is very time
consuming, and even more time consuming is the calculation of the
corresponding angle factors. That is why the use of the Mean Radiant
Temperature is avoided if possible.
The Globe Temperature, the Air Temperature and the Air Velocity at a
point can be used as input for a Mean Radiant Temperature calculation. The
quality of the result is, however, doubtful, partly because the angle
factors between the globe and the surfaces in a room are different from
those between a person and the same surfaces, and partly due to the
uncertainty of the convective heat transfer coefficient for the globe.
Use of the Globe Temperature for calculation of Mean Radiant
Temperature and a procedure for calculation of Mean Radiant Temperature on
the basis of Plane Radiant Temperatures can be seen in Appendix E.
What are Operative, Equivalent and Effective
Temperatures?
The way the integrated temperatures are defined and calculated can be
explained using the figure. The reasoning behind all 3 temperatures
mentioned is the same.
Imagine that you take a person and move him from a real room into an
imaginary room. Then adjust the temperature in the imaginary room until
the person experiences the same heat loss here, as in the real room.
Finally, determine the Air Temperature in the imaginary room, which by
definition is the integrated temperature.
Each of the integrated temperature parameters has its own specific
condition which must be fulfilled in the imaginary room; these are:
The ET* and teq values are dependent on the persons level of
activity and clothing, whereas the value to is normally
independent of these parameters. The equation system for calculating
to and teq is listed in Appendix A. The Operative
Temperature can also be calculated using a simplified equation. For this
see Appendix F. Equations for calculation of ET* can be found in the
ASHRAE handbook /7/.
Operative and Equivalent Temperature can be measured
directly
It can be shown that the Operative Temperature at a given point for
most applications will equal the temperature an unheated mannequin dummy
adjusts itself to. An Operative Temperature transducer must therefore have
heat exchange properties similar to those of an unheated mannequin dummy.
Or, to be more precise, the transducer and the mannequin must have:
• The same convection to radiation heat loss ratio.
• The same
angle factor to their surroundings.
• The same absorption factor
(emissivity) for long and short wave radiation.
A light grey ellipsoid shape, 160 mm long and with a diameter of 54 mm,
satisfies the specifications required for an Operative Temperature
transducer. Equip this with a sensor to measure the average surface
temperature and we now have an operative temperature transducer.
As a person’s angle factor to their surroundings changes as they change
position, the transducer must also be able to assume different positions
in order for it to measure in different workplaces.
By heating the Operative Transducer to the same temperature as the
surface temperature of a person’s clothing, the Dry Heat Loss ( H ) from
the body can be obtained directly. H is simply determined by the amount of
energy required to sustain the surface temperature of the transducer.
If H is known, the Equivalent Temperature teq can be
calculated and vice versa. The equation’s used for this conversion can be
seen in Appendix A.
How to create Thermal Comfort
When evaluating a workplace, we often talk about the Comfortable
Temperature ( tco ), which is defined as the Equivalent
Temperature where a person feels thermally comfortable. We rarely talk
about comfortable humidity, this is partly due to the difficulty of
feeling the humidity in the air and partly due to humidity having only a
slight influence on a person’s heat exchange when they are close to a
state of thermal comfort.
The comfort temperature in a given environment can be calculated from
the comfort equation (see Appendix B). In the figure a few results from
such calculations can be seen. Notice how warm it should be if someone is
sitting doing work wearing a light summer dress.
If a room contains many people, wearing different types of clothing and
carrying out different types of activities, it can be difficult to create
an environment which provides thermal comfort for all the occupants.
Something can be done by changing the factors that affect the thermal
comfort locally, for example, if the equivalent temperature is lower than
the comfort temperature, the mean radiant temperature can be increased by
installing heated panels.
Fortunately, individuals can often optimise their own thermal comfort
simply by adjusting their clothing to suit the conditions, for example, by
removing a jumper, rolling up shirt sleeves or alternatively putting on a
jacket.
The PMV and PPD scales
If the thermal comfort in a workplace is not perfect, how far from
perfect is it? Or within what limits should we maintain temperature and
humidity to enable reasonable thermal comfort? The answers to these
questions can be obtained from the PMV-index (Predicted Mean Vote). The
PMV-index predicts the mean value of the subjective ratings of a group of
people in a given environment.
The PMV scale is a seven-point thermal-sensation scale ranging from -3
(cold) to +3 (hot), where 0 represents the thermally neutral sensation.
Even when the PMV-index is 0, there will still be some individuals who
are dissatisfied with the temperature level, regardless of the fact that
they are all dressed similarly and have the same level of activity -
comfort evaluation differs a little from person to person.
To predict how many people are dissatisfied in a given thermal
environment, the PPD-index (Predicted Percentage of Dissatisfied) has been
introduced. In the PPD-index people who vote -3, -2, +2, +3 on the PMV
scale are regarded as thermally dissatisfied.
Notice that the curve showing the relationship between PMV and PPD
never gets below 5% dissatisfied.
How to calculate the PMV and PPD values can be seen in Appendix B.
Local Thermal Discomfort
Even though a person has a sensation of thermal neutrality, parts of
the body may be exposed to conditions that result in thermal discomfort.
This local thermal discomfort can not be removed by raising or lowering
the temperature of the enclosure. It is necessary to remove the cause of
the localised over-heating or cooling.
Generally, local thermal discomfort can be grouped under one of the
following four headings:
1. Local convective cooling of the body caused by draught
2. Cooling or heating of parts of the body by radiation. This is known
as a radiation asymmetry problem.
3. Cold feet and a warm head at the same time, caused by large vertical
air temperature differences.
4. Hot or cold feet, caused by uncomfortable floor temperature.
Remember, only when both the local and general thermal comfort
parameters have been investigated, can the quality of the thermal
environment be judged.
Draught
Draughts are the most common complaint when talking about indoor
climate in air-conditioned buildings, vehicles and aeroplanes. Man can not
feel air velocity, so what people actually complain about is an unwanted
local cooling of the body.
People are most sensitive to draught in the unclothed parts of the
body. Therefore, draughts are usually only felt on the face, hands and
lower legs.
The amount of heat loss from the skin caused by draughts is dependent
on the average air velocity, as well as the turbulence in the airflow and
the temperature of the air.
Due to the way the cold sensors in the skin work, the degree of
discomfort felt is not only dependent on the local heat loss, the
fluctuation of the skin temperature has an influence too. A high turbulent
air-flow is felt to be more annoying than a low turbulent air-flow, even
though they result in the same heat loss.
It is believed that it is the many steep drops in the skin temperature
caused by the fluctuation, that initiates excessive discomfort signals to
be sent from the cold sensors.
We know a bit about what types of fluctuations cause the greatest
discomfort. This knowledge has been obtained by submitting groups of
individuals to various air velocity frequencies. Fluctuation with a
frequency of 0.5 Hz are the most uncomfortable, while frequencies above 2
Hz are not felt.
Evaluating the Draught Rate
The percentage of people predicted to be dissatisfied because of a
draught may be calculated by using the following equation:

where:
DR Draught Rating
[%]
ta Air Temperature
[°C]
va Local Mean Air Velocity
[m/s]
SD Standard Deviation of air velocity [m/s]
To describe how fluctuating the air velocity is, we often use the term
"Turbulence Intensity" which is defined as:
The Draught Rate equation is from the ISO 7730 standard, and is based
on studies comprising 150 subjects. The equation applies to people at
light mainly sedentary activity, with an overall thermal sensation close
to neutral. To calculate va and SD a periode of 3 minutes is used. For a
transducer which is to be used for Draught Rating measurement, a number of
severe demands are set. It must be able to measure: air velocity down to
0.05m/s, fluctuations up to 2 Hz, and must be unaffected by the direction
of the air flow.
At lower velocities, the direction of the air flow in the occupied zone
changes rapidly. To position an air velocity transducer in one particular
direction is therefore not possible, and consequently an omnidirectional
transducer must be used.
Asymmetry of Thermal Radiation
If you stand in front of a blazing bonfire on a cold day, after a
period of time your back will begin to feel uncomfortably cold. This
discomfort can not be remedied by moving closer to the fire, resulting in
an increased body temperature. This is an example of how non-uniform
thermal radiation can result in the body feeling uncomfortable. To
describe this non uniformity in the thermal radiation field, the parameter
Radiant Temperature Asymmetry is used. This parameter is defined as the
difference between the Plane Radiant Temperature of the two opposite sides
of a small plane element.
Experiments exposing people to changing degrees of radiant temperature
asymmetry have proved that warm ceilings and cold windows cause the
greatest discomfort, while cold ceilings and warm walls cause the least
discomfort. During these experiments all the other surfaces in the room
and the air were kept at an equal temperature.
The parameter Radiant Temperature Asymmetry can be obtained in two
ways. One, by measuring tpr in two opposite directions using a
transducer that integrates the incoming radiation on to a small plane
element from the hemisphere about it. The other is, to measure the
temperatures of all the surrounding surfaces and then calculate Radiant
Temperature Asymmetry. In Appendix F the procedure to be used for such a
calculation can be seen.
Vertical Air Temperature Difference
Generally it is unpleasant to be warm around the head whilst at the
same time being cold around the feet, regardless of this being caused by
radiation or convection. In the last section we looked at the acceptance
limits of Radiant Temperature Asymmetry. Here we will look at what air
temperature difference is acceptable between the head and feet.
Experiments were carried out with people in a state of thermal
neutrality. The results, displayed in the diagram, showed that a 3°C air
temperature difference between head and feet gave a 5% dissatisfaction
level. The 3°C have been chosen as the ISO 7730 acceptance level for a
sitting person at sedentary activity.
When measuring air temperature differences it is important to use a
transducer which is shielded against thermal radiation. This ensures that
the air temperature is measured and not an undefined combination of air
and radiant temperature.
The Vertical Air Temperature difference is expressed as the difference
between the Air Temperature at ankle level and the Air Temperature at neck
level.
Floor Temperature
Due to the direct contact between feet and floor, local discomfort of
the feet can often be caused by too high or too low a floor
temperature.
To talk about thermal discomfort caused by the floor temperature is
incorrect as it is the heat loss from the feet that causes the discomfort.
The heat loss depends on parameters other than the floor temperature, such
as the conductivity and the heat capacity of the material the floor is
made from and the type of covering worn on the feet.
It is the difference in conductivity and heat capacity that makes cork
floors feel warm to the touch whilst marble floors feel cold.
If people wear "normal indoor footwear" the floor material is less
significant. Therefore, it has been possible to set some comfort levels
for this "normal" situation.
The ISO 7730 standard sets comfort levels at sedentary activity to 10%
dissatisfied. This leads to acceptable Floor Temperatures ranging from
19°C to 29°C.
Quite different recommendations are valid for floors occupied by people
with bare feet. In a bathroom the optimal temperature is 29°C for a marble
floor and 26°C for hard linoleum on wood.
How to perform a measurement in a workplace
Where should the transducer be placed when measuring at a workplace?
The positions normally used for sitting and standing persons are shown in
the figure.
In general, the transducers should be placed at the person’s centre of
gravity. Exceptions to this rule are when Vertical Air Temperature
Differences and draughts are being measured. These measurements must be
made at both ankle and neck levels.
Dependent on the method chosen to measure the Dry Heat Loss H one, two
or tree transducers are needed. The options are:
• A Dry Heat Loss transducer
• An Operative Temperature and an Air
Velocity transducer.
• A Radiant Temperature, an Air Temperature and
an Air Velocity transducer.
For evaluation of thermal comfort at a workplace for sedentary
activity, ISO 7730 suggests the following requirements:
• -0.5 < PMV < +0.5
• DR < 15% at neck and ankle.
•
Vertical Air Temperature Differences from ankle to head should be less
than 3°C.
• Radiant Temperature Asymmetry from cold windows should be
less than 10°C.
• Radiant Temperature Asymmetry from warm ceilings
should be less than 5°C.
• Surface Temperature of floors should be
between 19°C and 29°C.
• Relative Humidity should be between 30% and
70%.
How to evaluate the Thermal Quality of a room
In rooms with several workplaces under a common climatic control
system, one has to evaluate comfort in a number of steps.
1.
Uniformity of the thermal climate within the working area. This
can be evaluated by measuring PMV values at a few workplaces
simultaneously. Among the places chosen should be the one expected to be
the coldest, the one expected to be the warmest and one in the centre of
the room.
2.
The ability of the climatic control system to maintain a stable
thermal climate. By logging the time history of the PMV value, variations
in the thermal climate are easily unveiled.
3.
Risk of local thermal discomfort in the working area. This can
be measured one workplace at a time as described in the previous
chapters.
In rooms where the workplaces are not easily identified the measurement
point should be placed at least 0.6 m away from walls or fixed heating or
air-conditioning equipment.
The PMV calculation must be done with clothing and activity values
which are reasonable for the room in question.
Further Reading
/1/ P.O. Fanger, Thermal Comfort, McGraw-Hill Book Company 1972.
/2/ ISO 7730, Moderate Thermal Environments - Determination of the PMV
and PPD indices and specification of the conditions for thermal comfort,
1995.1)
/3/ ISO 7726, Thermal Environment - Instruments and method for
measuring physical quantities, 1985.1)
/4/ ISO/DIS 13731, Ergonomics of the Thermal Environment - Definition
and units, February 1996.1)
/5/ ISO 8996, Ergonomics - Determination of Metabolic Heat Production,
1990.1)
/6/ ISO 9920, Ergonomics of the Thermal Environment - Estimation of the
thermal insulation and evaporative resistance of a clothing ensemble,
1995.1)
/7/ ASHRAE handbook Fundamentals, American Society of Heating and Air
Conditioning Engineers, Atlanta 1993.
/8/ B.W. Olesen, Thermal Comfort Requirement for Floors Occupied by
People with Bare Feet, ASHRAE Trans., Vol. 83 Part 2, 1977.
/9/ E.A. McCullough, B.W. Olesen and S. Hong, Thermal Insulation
Provided by Chairs, ASHRAE Transactions 1994.
/10/ P.O. Fanger, A.K. Melikov, H. Hanzawa and J. Ring. Air Turbulence
and Sensation of Draught. Energy and Building 12(1988) 21-39, Elsevier
Amsterdam 1988.
/11/ D.A. McIntyre, Indoor Climate, Applied Science publishers LTD,
London 1980
/12/ T.H. Benzinger, The Physiological Basis for Thermal Comfort,
Proceedings of the First International Indoor Climate Symposium, Danish
Building Research Institute, Copenhagen 1979.
1) International Organization for Standardization, Geneva.
Appendix A: Dry Heat Loss calculations
The Dry Heat loss:
or written with Operative Temperature:
or written with Equivalent Temperature:
another equation for H is:
when equations 1 and 2 are combined,
tcl can be derived:
or written with Operative Temperature:
or written with Equivalent Temperature:
where:
Calculation of tcl is an iterative process, whereas, the calculation of
H is more straightforward.
The equation is in accordance with ISO 7730 /ref. 2/.
Appendix B: Heat Balance, Comfort and PMV equations
Heat Balance equation for the body:
Comfort equation:
PMV equation:
PPD equation:

Procedure for the calculation of parameters in the above
equations:
H is either measured directly using a dry heat loss transducer or
calculated from the equation in Appendix A.
Esw and
tsk in the heat balance equation have to be measured.
The
external work W can, in most cases, be set equal to zero.
All equations are in accordance with Fanger /ref. 1/ and ISO 7730 /ref.
2/.
In the comfort and PMV equations the physiological response of the
thermoregulatory system has been related statistically to thermal
sensation votes collected from more than 1300 subjects.
Appendix C: Met value tableActivity Metabolic rates [M] W/m2 Met
-------------------------------------------------------------------------
Reclining 46 0.8
Seated relaxed 58 1.0
Clock and watch repairer 65 1.1
Standing relaxed 70 1.2
Sedentary activity (office, dwelling, school, laboratory) 70 1.2
Car driving 80 1.4
Graphic profession - Book Binder 85 1.5
Standing, light activity (shopping, laboratory, light industry) 93 1.6
Teacher 95 1.6
Domestic work -shaving, washing and dressing 100 1.7
Walking on the level, 2 km/h 110 1.9
Standing, medium activity (shop assistant, domestic work) 116 2.0
Building industry -Brick laying (Block of 15.3 kg) 125 2.2
Washing dishes standing 145 2,5
Domestic work -raking leaves on the lawn 170 2.9
Domestic work -washing by hand and ironing (120-220 W/m2) 170 2.9
Iron and steel -ramming the mould with a pneumatic hammer 175 3.0
Building industry -forming the mould 180 3.1
Walking on the level, 5 km/h 200 3.4
Forestry -cutting across the grain with a one-man power saw 205 3.5
Agriculture -Ploughing with a team of horses 235 4.0
Building industry -loading a wheelbarrow with stones and mortar 275 4.7
Sports -Ice skating, 18 km/h 360 6.2
Agriculture -digging with a spade (24 lifts/min.) 380 6.5
Sports -Skiing on level, good snow, 9 km/h 405 7.0
Forestry -working with an axe (weight 2 kg. 33 blows/min.) 500 8.6
Sports -Running, 15 km/h 550 9.5
Appendix D: Clo values tableGarment description Iclu Clo m2°C/W
-----------------------------------------------------------------------
Underwear, pants Pantyhose 0.02 0.003
Panties 0.03 0.005
Briefs 0.04 0.006
Pants 1/2 long legs, wool 0.06 0.009
Pants long legs 0.1 0.016
Underwear, shirts Bra 0.01 0.002
Shirt sleeveless 0.06 0.009
T-shirt 0.09 0.014
Shirt with long sleeves 0.12 0.019
Half-slip, nylon 0.14 0.022
Shirts Tube top 0.06 0.009
Short sleeve 0.09 0.029
Light weight blouse, long sleeves 0.15 0.023
Light weight, long sleeves 0.20 0.031
Normal, long sleeves 0.25 0.039
Flannel shirt, long sleeves 0.3 0.047
Long sleeves, turtleneck blouse 0.34 0.053
Trousers Shorts 0.06 0.009
Walking shorts 0.11 0.017
Light-weight trousers 0.20 0.031
Normal trousers 0.25 0.039
Flannel trousers 0.28 0.043
Overalls 0.28 0.043
Coveralls Daily wear, belted 0.49 0.076
Work 0.50 0.078
Highly-insulating Multi-component, filling 1.03 0.160
coveralls Fibre-pelt 1.13 0.175
Sweaters Sleeveless vest 0.12 0.019
Thin sweater 0.2 0.031
Long sleeves, turtleneck (thin) 0.26 0.040
Sweater 0.28 0.043 Thick sweater 0.35 0.054
Long sleeves, turtleneck (thick) 0.37 0.057
Jacket Vest 0.13 0.020
Light summer jacket 0.25 0.039
Jacket 0.35 0.054
Smock 0.3 0.047
Coats and Coat 0.6 0.093
overjackets Down jacket 0.55 0.085
and overtrousers Parka 0.7 0.109
Overalls multi-component 0.52 0.081
Sundries Socks 0.02 0.003
Thick, ankle socks 0.05 0.008
Thick, long socks 0.1 0.016
Slippers, quilted fleece 0.03 0.005
Shoes (thin soled) 0.02 0.003
Shoes (thick soled) 0.04 0.006
Boots 0.1 0.016 Gloves 0.05 0.008
Skirts, dresses Light skirt, 15 cm. above knee 0.10 0.016
Light skirt, 15 cm. below knee 0.18 0.028
Heavy skirt, knee-length 0.25 0.039
Light dress, sleeveless 0.25 0.039
Winter dress, long sleeves 0.4 0.062
Sleepwear Long sleeve, long gown 0.3 0.047
Thin strap, short gown 0.15 0.023
Hospital gown 0.31 0.048
Long sleeve, long pyjamas 0.50 0.078
Body sleep with feet 0.72 0.112
Undershorts 0.1 0.016
Robes Long sleeve, wrap, long 0.53 0.082
Long sleeve, wrap, short 0.41 0.064
Chairs Wooden or metal 0.00 0.000
Fabric-covered, cushioned, swivel 0.10 0.016
Armchair 0.20 0.032
Appendix E: Calculation of Mean Radiant Temperature
Equation for calculating the Mean Radiant
Temperature from the Air-and Globe Temperature:

The following equation can be used for
calculating the heat transfer coefficient:

For a globe (from /ref. 3/):
For an Operative Temperature Transducer1:
1) An ellipsoid shaped sensor that is 160 mm long and 54 mm
in diameter
Mean Radiant Temperature estimated from a measured value of Plane
Radiant Temperature
The Mean Radiant Temperature can be calculated with a good degree of
accuracy from six measured values of the Plane Radiant Temperature.
For a sitting person the equation is:
and for a standing person:
Appendix F: Calculation of Plane Radiant and Operative
Temperature
The following equation may be used to calculate the Plane Radiant
Temperature:

ti is surface temperature of surface no. i
[°C]
Fpl-i is angle factor between a small plane and surface
i. 
Calculation of Operative Temperature
The following simplified equation gives reasonable accuracy:
The equation is from /ref. 2/
Nomenclature
| a |
Width of a rectangular surface. |
[m] |
| ADu |
DuBois body surface area. The total surface area of a
naked person as estimated by the DuBois formula. |
[m2] |
| Ai |
Area of plane surface. |
[m2] |
| Ar |
Effective radiant area of a body. Surface that
exchanges radiant energy with the environment through a solid angle
of 4¹. This is smaller than the actual surface area of the body
because the body is not a convex surface. |
[m2] |
| b |
Length of a rectangular surface. |
[m] |
| c |
Distance between the two surfaces. |
[m] |
| Cres |
Respiratory convective heat exchange.
|
[W/m2] |
| D |
Diameter of globe transducer. |
[m] |
| DR |
Draught Rate. The percentage of people
dissatisfied due to draught. |
[%] |
| E |
Evaporative heat exchange at the skin. |
[W/m2] |
| Ec |
Evaporative heat exchange at the skin,
when the person experiences a sensation of thermal neutrality. |
[W/m2] |
| Eres |
Respiratory evaporative heat exchange. |
[W/m2] |
| Esw |
Evaporative heat loss from evaporation
of sweat. |
[W/m2] |
| ET* |
Effective temperature (new effective temperature) |
[°C] |
| fcl |
Clothing area factor. The ratio of the
surface area of the clothed body to the surface area of the naked
body. |
|
| Fp-i |
Angle factor between the person and surface i .
Defined as the fraction of diffuse radiant energy leaving the body
surface which falls directly upon surface i |
|
| Fpl-i |
Angle factor between a small plane and
surface i . Defined as the fraction of diffuse radiant energy
leaving the small plane surface which falls directly upon surface i
|
|
| hc |
Convective heat transfer coefficient. |
[W/m2/°C] |
| hc,eq |
Convective heat transfer coefficient
when air velocity in enclosure is zero. |
[W/m2/°C] |
| hcg |
Convective heat transfer coefficient for a globe
(ellipsoid). |
[W/m2/°C] |
| hr |
Radiative heat transfer coefficient.
|
[W/m2/°C] |
| H |
Dry Heat Loss. Heat loss from the body surface through
convection, radiation and conduction. |
[W/m2] |
| Icl |
Clothing insulation. It is an average
including uncovered parts of the body. |
[m2°C/W] |
| Iclu |
Garment insulation. Expressed as the overall increase
in insulation attributable to the garment. |
[m2°C/W] |
| Kcl |
Conductive heat flow through clothing.
|
[W/m2] |
| M |
Metabolic rate. The rate of transformation of chemical
energy into heat and mechanical work by aerobic and anaerobic
activities within the body. |
[W/m2] |
| pa |
Humidity. Partial water vapour
pressure in the air. |
[Pa] |
| p’a |
Humidity in the imaginary room. |
[Pa] |
| PMV |
Predicted Mean Vote. The predicted
mean vote of a group of people on the 7-point thermal sensation
scale. |
|
| PPD |
Predicted Percentage of Dissatisfied. The predicted
percentage of a group of people who are feeling too cold or too hot.
|
[%] |
| q |
Heat exchange between body and
surroundings. |
[W/m2] |
| q’ |
Heat exchange between body and surroundings in the
imaginary room. |
[W/m2] |
| R |
Radiative heat exchange. |
[W/m2] |
| R’ |
Radiative heat exchange in the imaginary room. |
[W/m2] |
| RH |
Relative Humidity |
[%] |
| SD |
Standard Deviation of air velocity |
[m/s] |
| ta |
Air Temperature |
[°C] |
| t’a |
Air Temperature in imaginary room |
[°C] |
| tco |
Comfort Temperature. The Equivalent
Temperature at which a person experiences a sensation of thermal
neutrality. |
[°C] |
| tcl |
Clothing surface temperature. |
[°C] |
| teq |
Equivalent Temperature. |
[°C] |
| tg |
Globe Temperature. |
[°C] |
| ti |
Temperature of surface no. i. |
[°C] |
| to |
Operative Temperature. |
[°C] |
 |
Mean Radiant Temperature |
[°C] |
 |
Mean Radiant Temperature in the imaginary room |
[°C] |
| tpr |
Plane Radiant Temperature. |
[°C] |
 |
Radiant Temperature Asymmetry |
[°C] |
 |
Mean skin temperature |
[°C] |
| Tu |
Turbulence Intensity. |
[%] |
| va |
Local Mean Air Velocity |
[m/s] |
| v’a |
Local Mean Air Velocity in the imaginary room |
[m/s] |
| var |
Relative Mean Air Velocity. The air
velocity relative to the occupant, including body movements. |
[m/s] |
| W |
Effective mechanical power. |
[W/m2] |
 |
Emission coefficient of the body
surface expressed as a ratio of the black body emissivity. |
|
 |
Stefan-Boltzmann constant (5.67 * 10-8) |
[W/m2/°C4] |
It is our hope that this booklet has been a useful introduction to
thermal comfort and the methods used to evaluate it. If you have any
questions about instrumentation or special applications, please contact
your local representative or write directly to:
Innova AirTech Instruments |